


FEEL FREE TO HOVER OVER TO UNCOVER MY STORY.





Hi I'm
Navdha.
FEEL FREE TO HOVER OVER TO UNCOVER MY STORY.
Hi I'm
Navdha.
FEEL FREE TO HOVER OVER TO UNCOVER MY STORY.
Hi I'm Navdha.


FEEL FREE TO HOVER OVER TO UNCOVER MY STORY.
Hi I'm Navdha.
FEEL FREE TO HOVER OVER TO UNCOVER MY STORY.
Hi I'm Navdha.

Design in action
Design in action
Design in action
Design in action
Shaped by story, structured by system, driven by strategy

Visualising Complex Science
Worked with the R&D – Oral Care team at Hindustan Unilever Limited to support research, synthesise insights, and translate complex enamel science into intuitive, impactful visuals through creative visualisation and animation.
MOTION GRAPHICS
SCIENTIFIC VISUALISATION

Showreel 2026
A little collection of things I've made, explored and learnt along the way. From graphic design and motion experiments to visual storytelling, this showreel brings together different bits of my creative journey, all in one place.
MOTION GRAPHICS
VISUAL STORYTELLING

The Asian Affairs
A complete branding project for a vibrant Pan-Asian dining destination in Ahmedabad. Building a distinct identity that brings the restaurant's personality to life across print, digital and physical spaces.
IDENTITY AND BRANDING
ART DIRECTION
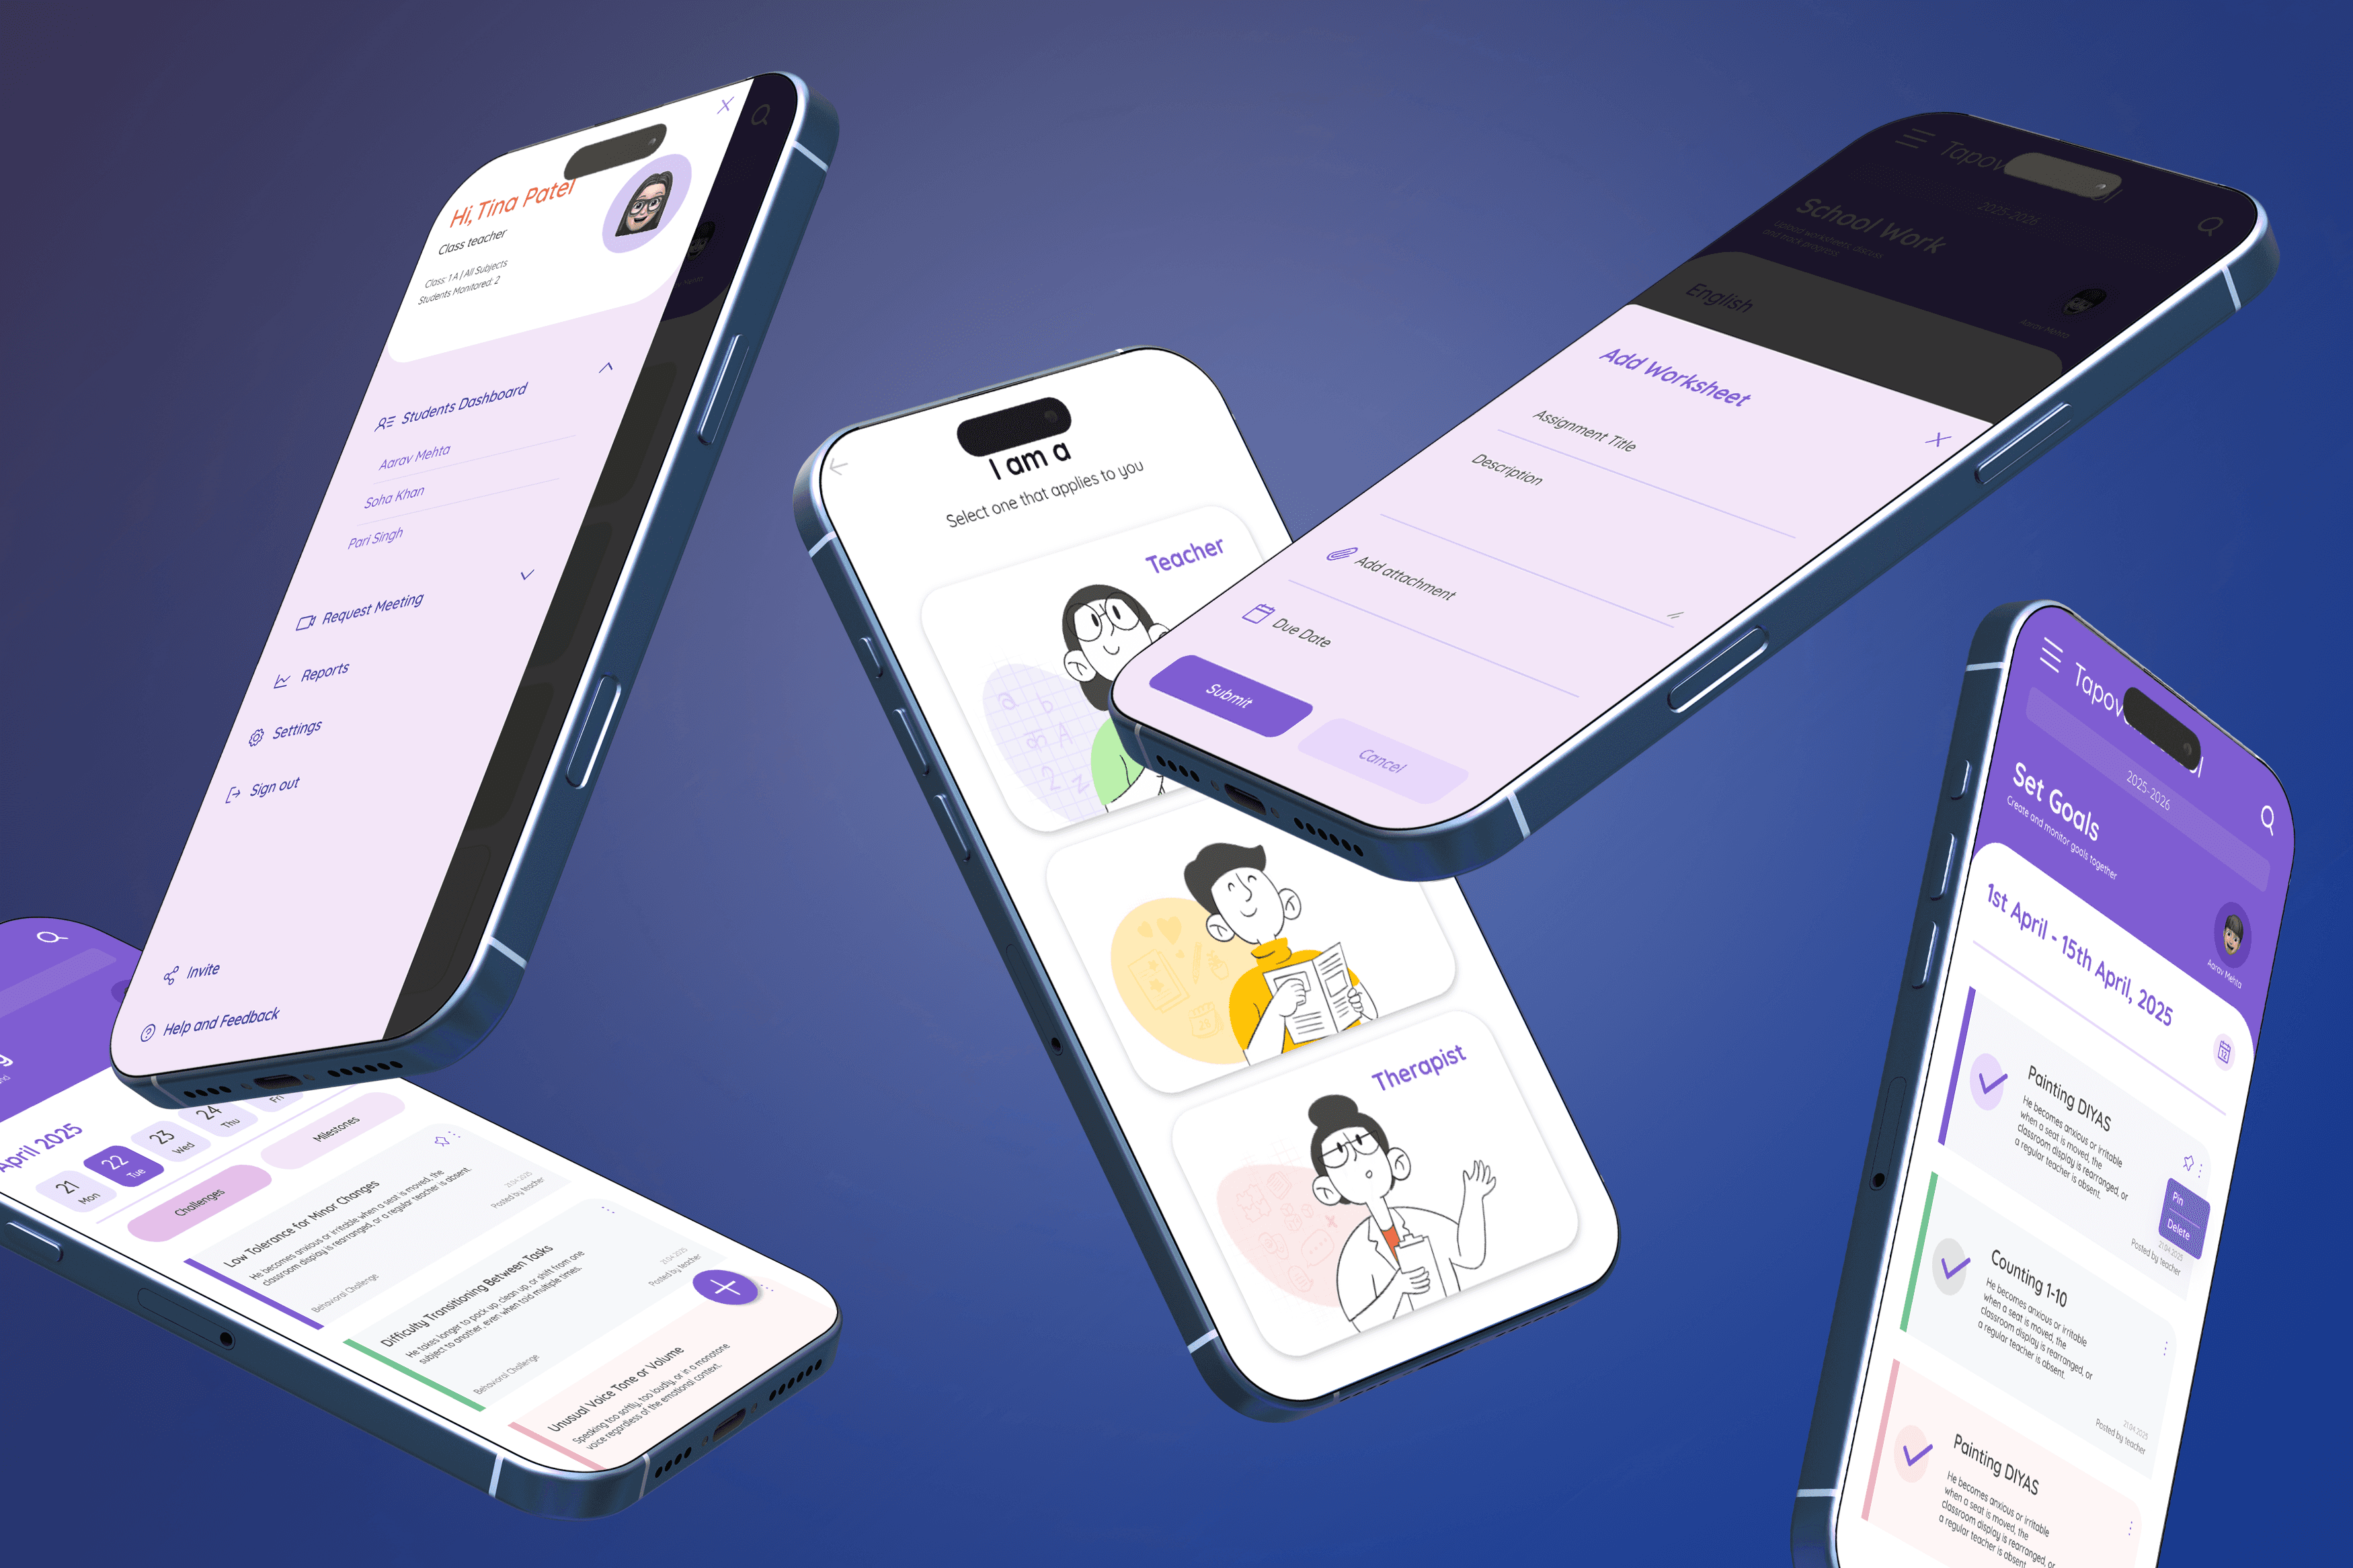
TinyWins
TinyWins is a digital platform that simplifies communication and progress tracking between parents, teachers and therapists, enabling consistent, collaborative support for neurodivergent children aged 5–8 in mainstream schools.
FINALIST @TISDC 2025
UX
UI

22 Tabs Open
“22 Tabs Open” is the identity and exhibition graphics for the Graphic Design Batch of 2022 at NID Ahmedabad. The branding visualises the batch’s shared creative chaos and parallel processes through the metaphor of open tabs.
IDENTITY AND BRANDING
EXHIBITION GRAPHICS

Is Democracy Perfect?
The project visualizes the evolution of democracy through its promises, flaws, and turning points. Using TidyTuesday’s “Democracy and Dictatorship” dataset (2024), it maps 70 years of global shifts in governance, suffrage, and power.
DATA ANALYSIS
DATA VISUALISATION

Sharma Khaan-daan
A two-day data visualisation assignment mapping family dynamics through thalis. Personality, habits, emotional distance and interaction modes were translated into visual attributes using food-based symbolism.
VISUAL STORYTELLING
DATA VISUALISATION

Open Elective 2024
Visual Identity for Open Elective 2024 at NID, a set of two-week long multidisciplinary workshops offered to the second year students of the B.Des and the first year students of M.Des programmes across the three NID campuses.
IDENTITY AND BRANDING
MOTION GRAPHICS
Visualising Complex Science
Worked with the R&D – Oral Care team at Hindustan Unilever Limited to support research, synthesise insights, and translate complex enamel science into intuitive, impactful visuals through creative visualisation and animation.
MOTION GRAPHICS
SCIENTIFIC VISUALISATION
Showreel 2026
A little collection of things I've made, explored and learnt along the way. From graphic design and motion experiments to visual storytelling, this showreel brings together different bits of my creative journey, all in one place.
MOTION GRAPHICS
VISUAL STORYTELLING

The Asian Affairs
A complete branding project for a vibrant Pan-Asian dining destination in Ahmedabad. Building a distinct identity that brings the restaurant's personality to life across print, digital and physical spaces.
IDENTITY AND BRANDING
ART DIRECTION
TinyWins
TinyWins is a digital platform that simplifies communication and progress tracking between parents, teachers and therapists, enabling consistent, collaborative support for neurodivergent children aged 5–8 in mainstream schools.
FINALIST @TISDC 2025
UX
UI
22 Tabs Open
“22 Tabs Open” is the identity and exhibition graphics for the Graphic Design Batch of 2022 at NID Ahmedabad. The branding visualises the batch’s shared creative chaos and parallel processes through the metaphor of open tabs.
IDENTITY AND BRANDING
EXHIBITION GRAPHICS
Is Democracy Perfect?
The project visualizes the evolution of democracy through its promises, flaws, and turning points. Using TidyTuesday’s “Democracy and Dictatorship” dataset (2024), it maps 70 years of global shifts in governance, suffrage, and power.
DATA ANALYSIS
DATA VISUALISATION
Sharma Khaan-daan
A two-day data visualisation assignment mapping family dynamics through thalis. Personality, habits, emotional distance and interaction modes were translated into visual attributes using food-based symbolism.
VISUAL STORYTELLING
DATA VISUALISATION
Open Elective 2024
Visual Identity for Open Elective 2024 at NID, a set of two-week long multidisciplinary workshops offered to the second year students of the B.Des and the first year students of M.Des programmes across the three NID campuses.
IDENTITY AND BRANDING
MOTION GRAPHICS
Thinking Out Loud
Thinking Out Loud
Branding
Branding
Data Visualisation
Data Visualisation
User Interface Design
User Interface Design
Illustration
Illustration
Visual Storytelling
Visual Storytelling
User Research
User Research
User Research
Motion Graphics
Motion Graphics
Design Systems & Strategy
Design Systems & Strategy

What I bring to the table
What I bring to the table
What I bring to the table
What I bring to the table
I design to connect people with ideas simply, thoughtfully, and in ways that stay.

Works in play
Works in play




Did something connect?
Did something connect?
Did something connect?
Did something connect?
Let's talk